Bever Team Online - Measurement While Drilling Module
Present the rock mass properties graphically by analyzing the drill logs from the jumbo
- Analysis of ready available drilling data can give important inputs to operation for increased safety and reduced operation cost
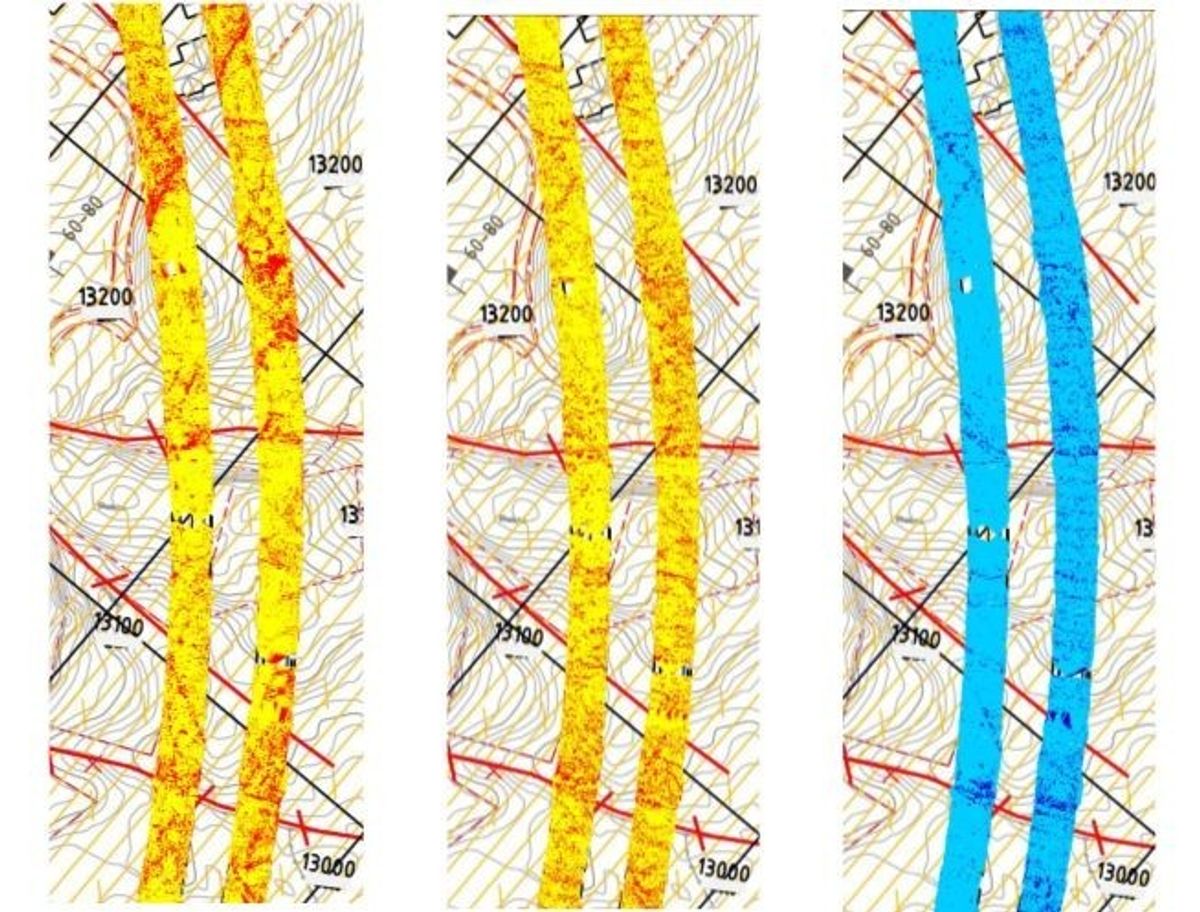
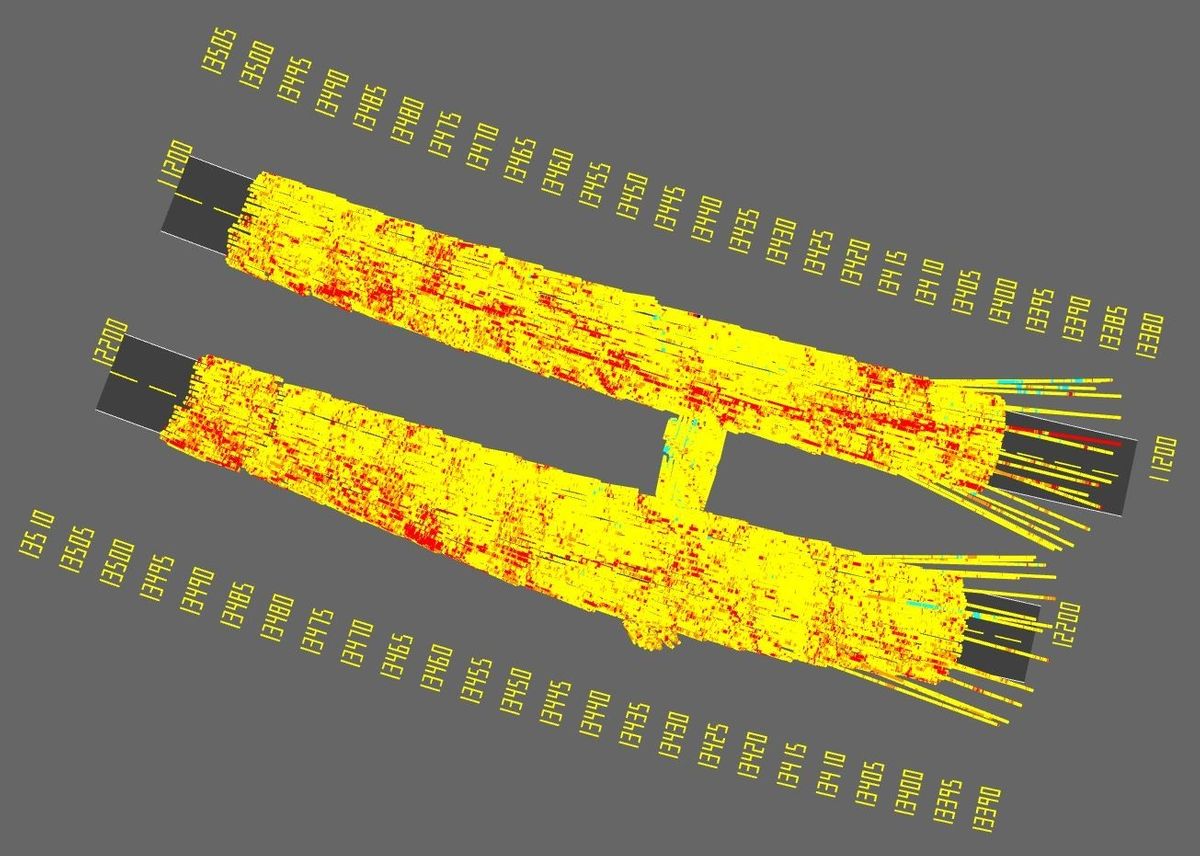
- Graphical 3D presentation of Interpreted Hardness, Fracturing, and Water
- Advanced analysis of drill logs from any drilling jumbo
- Near real-time analysis, data available for decision support on the spot
- Online system, wireless transfer from jumbo to cloud
- Automatically generated reports available in your web browser
Features:
- Web-based, accessible from any web browser
- Cloud database updated every few minutes
- Everyone works in the same version, and has access to the same "real time" information
- 3D-display and export into easy-to-send standard formats such as .pdf or .dwg
- Automatically generated reports, when you just want a quick update
- Generate your own reports
- Open system that facilitates in-depth analysis of data
- MWD maps of unfolded tunnel, or 3D
- 3D maps and coordinates of bolt drilling
- Option for shotcrete scanning with a rig-mounted Bever 3D Profiler
- Overburden calculations compared to design geometry
Methodology:
- The rock mass hardness is estimated based on a normalized and filtered penetration rate. The normalization process includes correction of varying average penetration rate, varying feeder- and hammer pressure at the start of the drilling, and filtering irrelevant data.
- The rock mass fracturing is estimated based on a variance calculation of the normalized penetration rate and rotation pressure. A gliding root mean quare value catches sudden changes in drillability within the rock mass.
- The water model is based on a normalized water flow. The normalizing corrects varying average water flow, incoming pressure and pressure drop in drill rods. Rapid changes in the amount of water is detected by calculating a root mean square value of the normalized water flow.